2026-07-16 · 4 min read
Session edge, AI coach verdict, and running P&L for 2026-07-16.
Trim Review
How much of today's result was carried by a few outliers? The table recomputes the core session stats with the biggest movers removed. Trimmed rows are colored vs baseline: green = holds most of the move, amber = meaningful erosion, red = collapses or flips sign.
| Scenario | Trades | Net P&L | Total R | E[R] / trade | $ WR | PF |
|---|---|---|---|---|---|---|
| Baseline (all trades) | 28 | −$2267.85 | -4.21R | -0.150R | 46.2% | 0.45 |
| − single best + single worst | 26 | −$1419.90 | -2.63R | -0.101R | 45.8% | 0.49 |
| − top 2 + bottom 2 (≈5% each tail) | 24 | −$996.46 | -1.85R | -0.077R | 45.5% | 0.52 |
Trimmed trades: Single best + single worst — removed RUBI +$469.55 (best) · STAK −$1317.50 (worst). Top 2 + bottom 2 — removed 2 from each tail (by $ P&L).
Broad-based red session: the loss is still there after trimming the biggest movers — this wasn't one bad trade, it was the whole book tilted the wrong way.
Session verdict
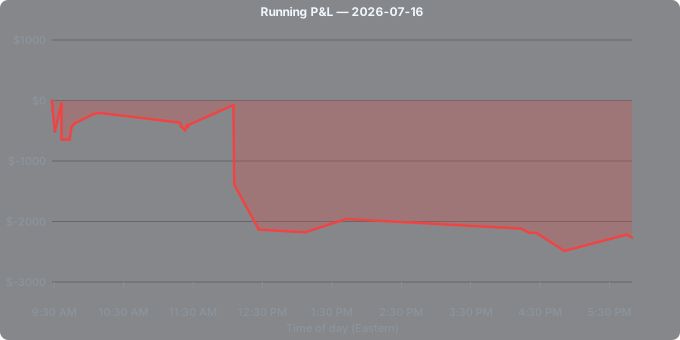
{"dayVerdict":"STAK was the day's defining trade and it did not work. The stock offered a genuine 107.5% open-to-high move, running from $2.12 at the open to $4.40 at 12:04pm ET, and it held 64% of that move into a $3.58 close — a real, tradeable runner.
Your two STAK longs, at 12:05pm and 12:25pm ET, came right at or just after the high and cost -$1.32k and -$743.56, a combined -$2.07k on the single best-offered move you touched all day. TGHL was the other loser of size: it moved 32.3% from $1.285 to $1.70 by 9:38am ET and held 57% of that move into the close, yet your 9:34am ET long lost -$600.
Across all three of your material trades (all losses, none of your winners reached even 1R), you were on the right names — STAK and TGHL both retained real percentages of their moves — but the entries landed adjacent to the highs rather than ahead of them, converting stocks that behaved well into losses.
Zooming out, the rest of the session was a scatter of small trades across 25 additional positions with a 42.9% win rate and a 0.45 profit factor — an avg loss of -$294 against an avg win of only $154 means the size of the losses, not the frequency, did the damage. Six of today's runners (ATPC, PMAX, RUBI, TGHL, VEEE, LEDS) show up in the market-context data; of those, RUBI put up a 32.4% open-to-high move that then reversed hard into a close 45% below the open (-139% retention), and VEEE ran 23.5% by 9:57am before giving nearly all of it back (17% retained) — neither appears among your fills, so the two most obviously fade-prone names of the day were correctly avoided.
The opportunity cost sits mainly in STAK itself: a 107.5% mover that you traded on both legs but captured none of.
Looking at the trailing week, the split between holders and bleeders is stark on move size and float. SOBR ran 194.9% on 7/13 (float 2.4M) and kept 64% of it, then ran again 56.5% on 7/15 and kept 41% — both times a sub-3M-float name with a clean, sustained afternoon or morning high.
By contrast, the large moves that collapsed hardest — RUBI (-139% retained), UBXG (-152%), VRAX (-225%), HAO (-240%), RKTO (-188%) — were mostly single-day spikes with early highs (RUBI 8:31am, VRAX 9:59am, RKTO 9:14am) that reversed through the session rather than consolidating. Your two touched names, STAK and TGHL, both fall on the holder side of that split (64% and 57% retained respectively), meaning the underlying setups you chose were sound; the losses came from timing the entries into the moves already having crested rather than from picking the wrong stocks."}