2020-12-31 · 4 min read
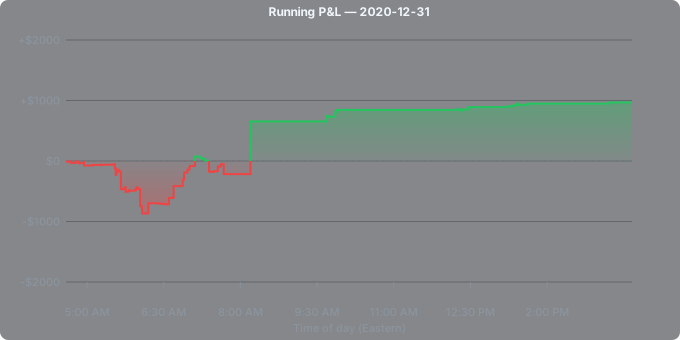
Session edge, AI coach verdict, and running P&L for 2020-12-31.
Trim Review
How much of today's result was carried by a few outliers? The table recomputes the core session stats with the biggest movers removed. Trimmed rows are colored vs baseline: green = holds most of the move, amber = meaningful erosion, red = collapses or flips sign.
| Scenario | Trades | Net P&L | Total R | E[R] / trade | $ WR | PF |
|---|---|---|---|---|---|---|
| Baseline (all trades) | 86 | +$967.97 | +38.72R | +0.450R | 62.4% | 1.59 |
| − single best + single worst | 84 | +$390.72 | +15.63R | +0.186R | 62.7% | 1.29 |
| − top 5 + bottom 5 (≈5% each tail) | 76 | +$480.12 | +19.20R | +0.253R | 64.0% | 1.76 |
Trimmed trades: Single best + single worst — removed PLTR +$871.26 (best) · WBAI −$294.00 (worst). Top 5 + bottom 5 — removed 5 from each tail (by $ P&L).
Broad green session: still clearly green after trimming the biggest movers, so the day was a stack of small plus-EV decisions compounding — not a few home runs.
Session verdict
No market-context feed came through for this session, so there is no way to size what today's runners actually offered in percentage terms or float/volume — the read here has to lean entirely on the fills themselves, which is a real limitation worth naming rather than papering over.
What the fills show is a high-frequency, low-conviction day: 86 positions, net $967.97, with a $ win rate of 61.6% and a profit factor of 1.59. Average win was $49.41 against an average loss of -$51.58 — a reward:risk under 1:1 that needed the better win rate to carry it, and it did, barely, for a four-figure net.
Zero trades reached even 1R in either direction; every single one of the 86 positions was a small decision, not a swing for a real move. That is a distribution of grinding, not of capturing outsized runner moves — there is no single trade here that looks like it caught a 50%+ intraday swing and rode it, because the material-trade list is empty at the 1R threshold.
Compare that to the prior session's defining trade, STKH, which offered a 367% open-to-high move and produced a +1.98R fill alongside a -1.17R loss bought right at the print high — today had nothing of that scale on either side of the ledger, win or loss.
The day-level shape is proportionate to what was likely a quieter opportunity set: many small, mostly-net-positive fills rather than a few large swings. Whether that reflects a day light on real runner moves or a trader intentionally sizing down after a rough stretch, the P&L pattern — 53 winners, 33 losers, $49 vs $52 average size — is consistent with scalping activity rather than trend-catching.
Without the runner universe for today, it's not possible to say whether a handful of stocks moved 30%+ and were left untouched; that opportunity-cost sentence can't be built responsibly from missing data.
The trailing 7-day context is worth flagging: net -$3.33k over 288 trades at a 61.1% win rate and 0.70 profit factor, a clear step down from the prior 30-day window's $3.46k net, 65.8% win rate, and 1.10 profit factor. Today's $967.97 net and 1.59 profit factor is actually an improvement against that recent slide, even though the day-over-baseline win-rate contrast (61.6% vs 66.5%, z = -0.957) is not statistically distinguishable given the sample.
None of the 30-minute windows in the evidence table clear a consistent same-direction bar across enough days to call out by name — the 8:00-8:30am window shows green in 10 of 14 days over 20 days for +$1,487, which is close to the threshold but the sample within today (n=1) is too thin to lean on. With no runner attribute data available this session, there is nothing in today's own numbers to link to the float/hold-time patterns seen in prior recaps — that comparison will have to wait for a day with the context feed intact.